Overview #
Today I built a complete SNMP-based observability pipeline for my UniFi infrastructure, focusing on:
- UDM-SE (gateway/router)
- UNAS Pro 4 (storage) The objective was straightforward: extract meaningful performance and system metrics from both devices and integrate them into my existing Grafana + Mimir stack using Grafana Alloy as the collection layer.
SNMP Discovery #
The first step was understanding what these devices actually expose via SNMP.
snmpwalk -v2c -c <community> <device>Findings
- Both devices rely heavily on Net-SNMP / UCD-SNMP MIBs
- The UNAS Pro 4 exposes:
- Disk I/O (UCD-DISKIO-MIB)
- CPU and load averages
- Memory utilization
- UniFi loads a custom SNMP module:
uiSystemInfo.soThis initially suggested a vendor-specific implementation, but in practice, most usable metrics still come from standard Linux SNMP trees.
⸻
Digging Deeper: Enterprise OIDs
The default SNMP walk did not expose disk-level visibility immediately. Expanding into the enterprise tree revealed more:
1.3.6.1.4.1This branch exposed:
- Memory metrics
- Disk I/O statistics
- CPU performance
- Sensor data (via lmSensors)
At this point, the project evolved from simple disk visibility into a full SNMP monitoring framework for UniFi devices.
⸻
SNMP Exporter Configuration
I created a custom snmp.yaml defining modules for both devices:
- unifi_udmse
- unifi_unas_pro4
Each module includes:
- Interface statistics
- CPU and memory metrics
- Disk I/O
- Load averages
Full configuration is available here:
👉 https://github.com/mikeosude/unifi-snmp-metrics
⸻
Grafana Alloy Integration
Instead of running a standalone SNMP exporter, I used Grafana Alloy to unify collection and forwarding.
Alloy handles:
- SNMP scraping
- Label enrichment
- Remote write to Mimir
Example configuration
prometheus.exporter.snmp "snmp_exporter" {
  config_file = "/etc/snmp_exporter/snmp.yml"
  target "unas_pro4" {
    address = "10.20.30.7"
    module  = "unifi_unas_pro4"
    auth    = "unifi_v2"
    labels = {
      device = "unas_pro4"
      role   = "nas"
    }
  }
}
prometheus.scrape "snmp" {
  targets    = prometheus.exporter.snmp.snmp_exporter.targets
  forward_to = [prometheus.remote_write.mimir.receiver]
}
⸻
Grafana Dashboard
With metrics successfully flowing into Mimir, I built a dashboard to visualize:
- Disk throughput
- Disk operations (IOPS)
- CPU and memory usage
- Load averages
- Network throughput
- Interface errors
⸻
Disk Throughput
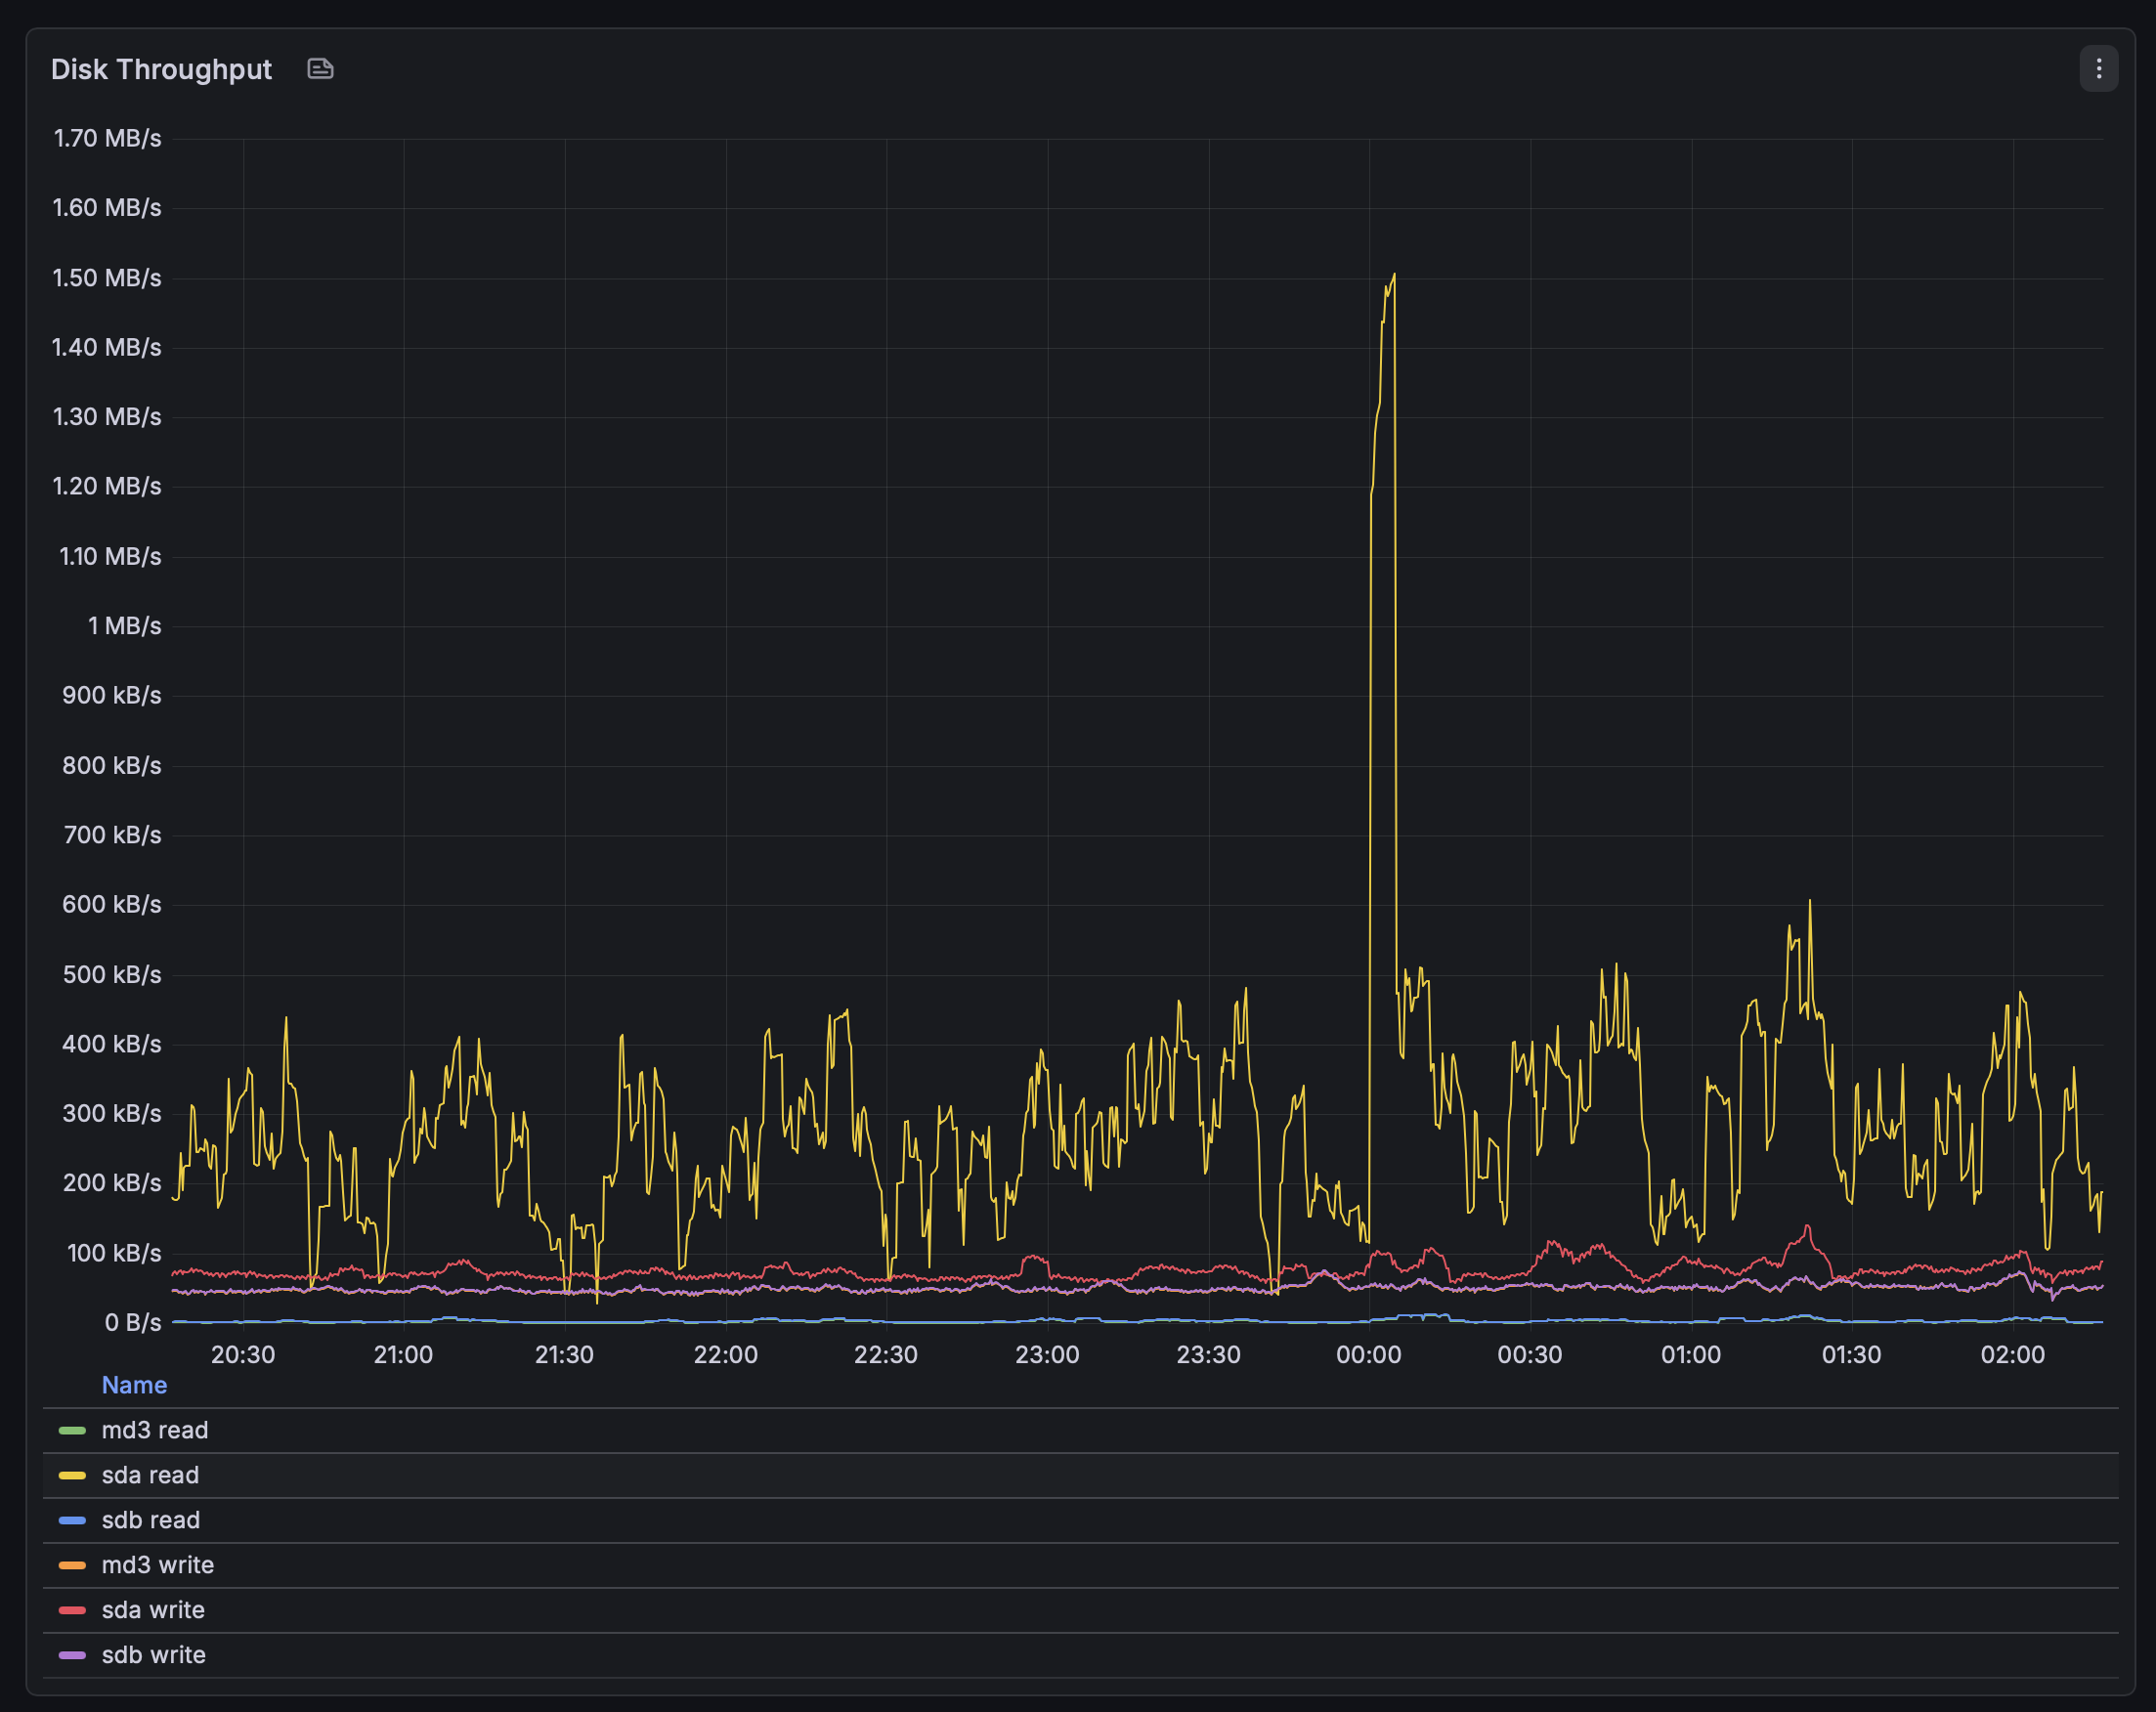
This panel shows read/write throughput across the UNAS disks and RAID layers.
- The workload is mostly steady with periodic spikes
- A noticeable burst around midnight likely corresponds to background processes such as indexing or maintenance tasks
- Individual disks (e.g., sda) show higher activity compared to aggregated RAID (md3)
⸻
Disk Operations
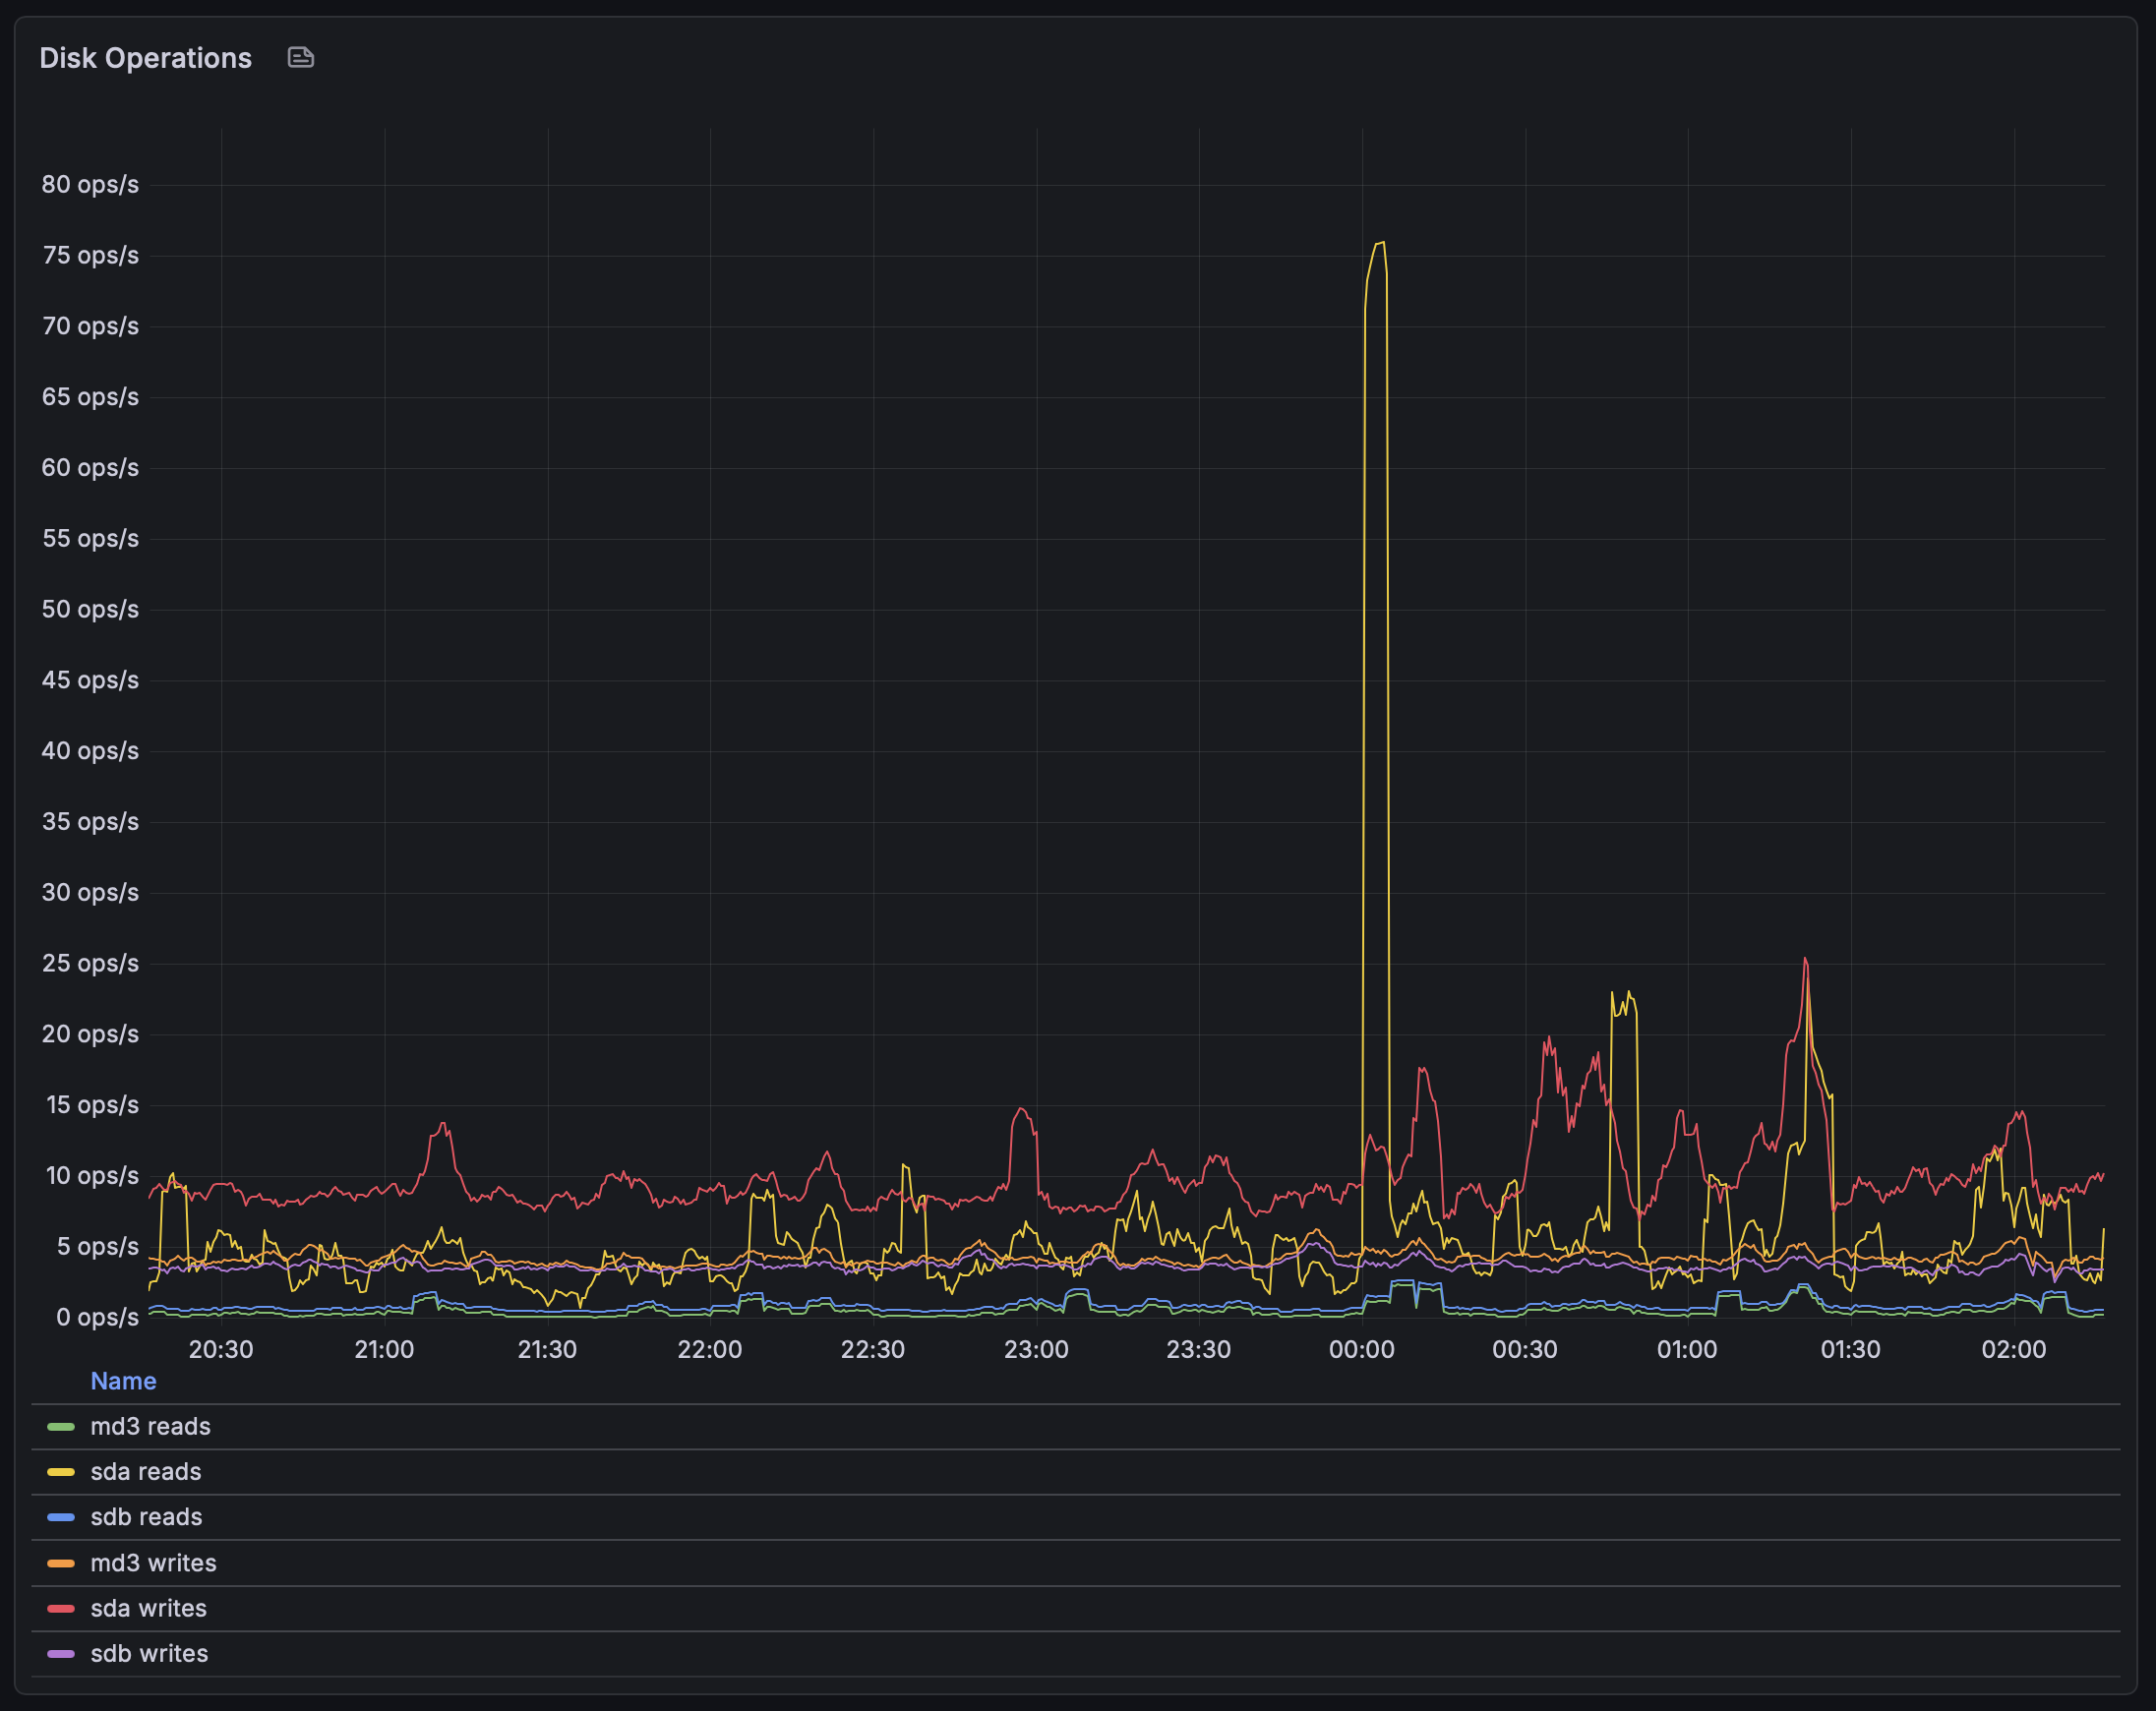
- Overall IOPS remains relatively low
- Spikes align with throughput bursts observed earlier
- The pattern suggests sequential or burst-driven workloads, rather than sustained random I/O
⸻
System Overview
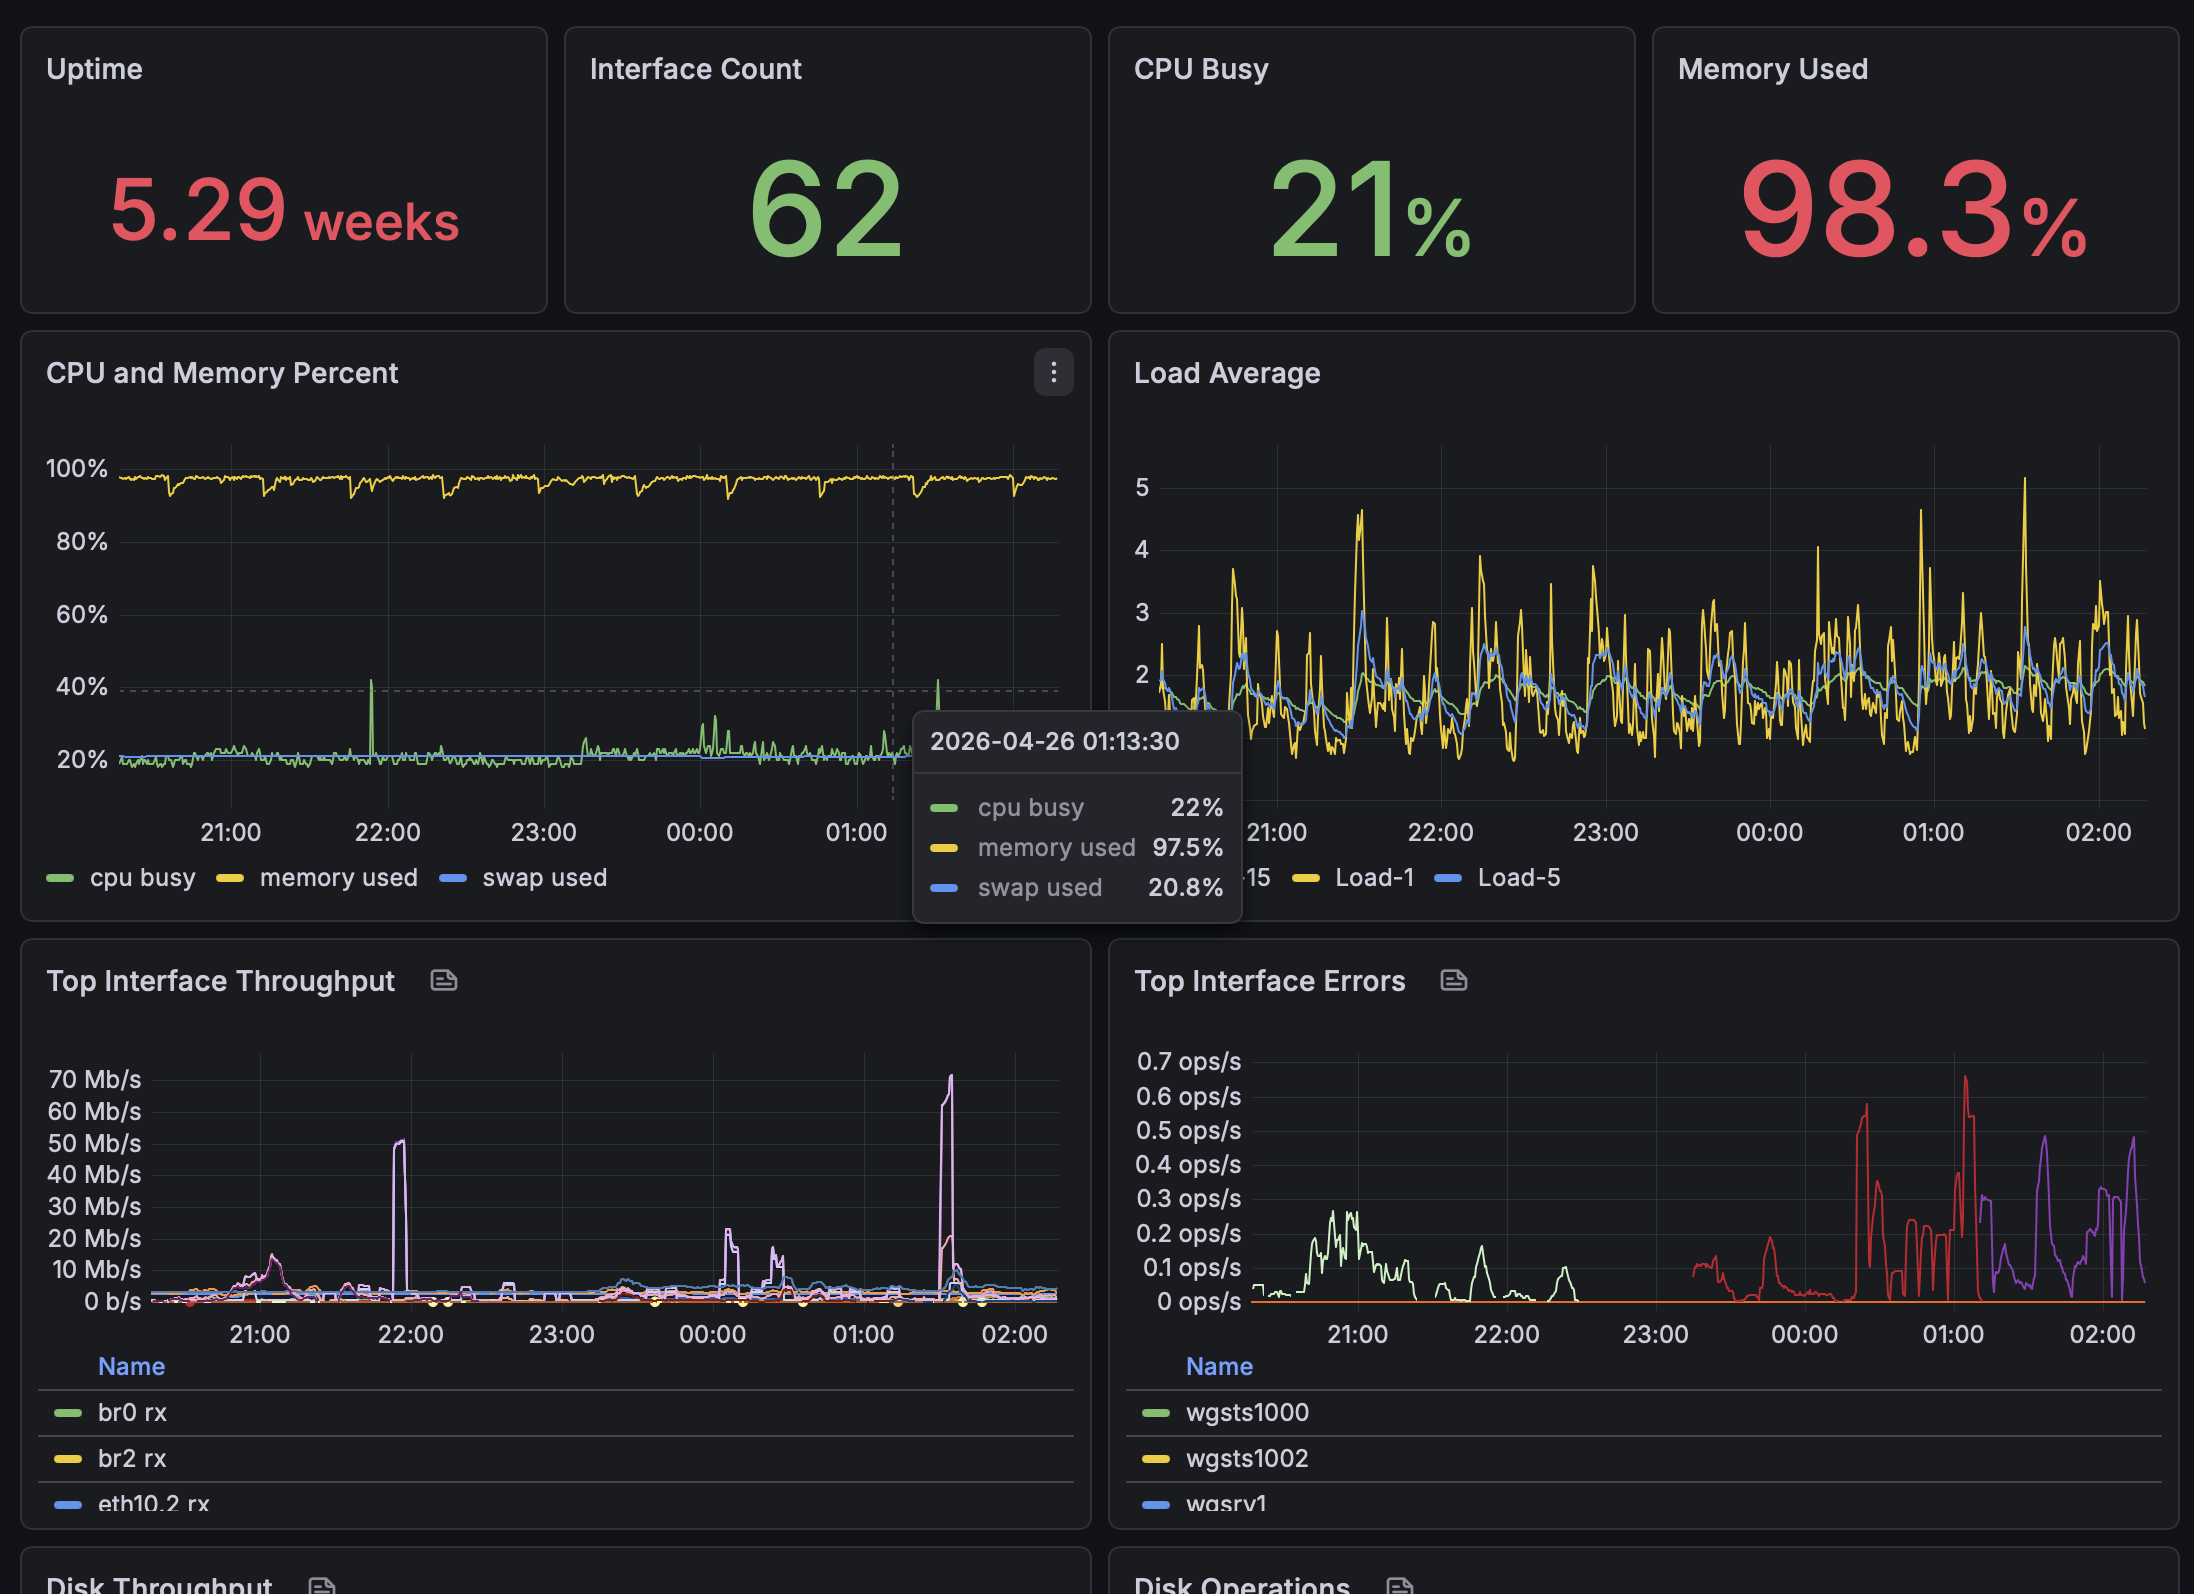
This dashboard section provides a high-level view of system health.
Key observations:
- CPU usage remains stable around ~20%
- Memory usage is consistently high (~98%), which is expected due to Linux filesystem caching
- Load averages remain within a healthy range relative to system capacity
- Network throughput and interface error panels help quickly identify anomalies
⸻
Key Takeaways
- UniFi devices expose sufficient SNMP data for practical observability
- Most useful metrics come from standard Linux MIBs, not proprietary ones
- Disk I/O metrics are available, but SMART/drive health data is not exposed via SNMP
- Grafana Alloy significantly simplifies the collection pipeline
- Mimir provides scalable, long-term metric storage
⸻
Next Steps
- Add SMART monitoring via SSH exporter or custom agent
- Implement alerting for:
- Interface errors
- Disk anomalies
- High load conditions
- Expand dashboards with:
- Per-disk breakdowns
- Per-interface visibility
- Cache vs capacity disk analysis
- More sensor data (fan, temperatures of system components)
⸻
Conclusion
This setup provides a solid observability foundation for my UniFi environment without requiring agents on the devices themselves.
It is:
- Lightweight
- Scalable
- Fully integrated into my existing Grafana ecosystem
More importantly, it turns previously opaque systems into something measurable, understandable, and actionable.