
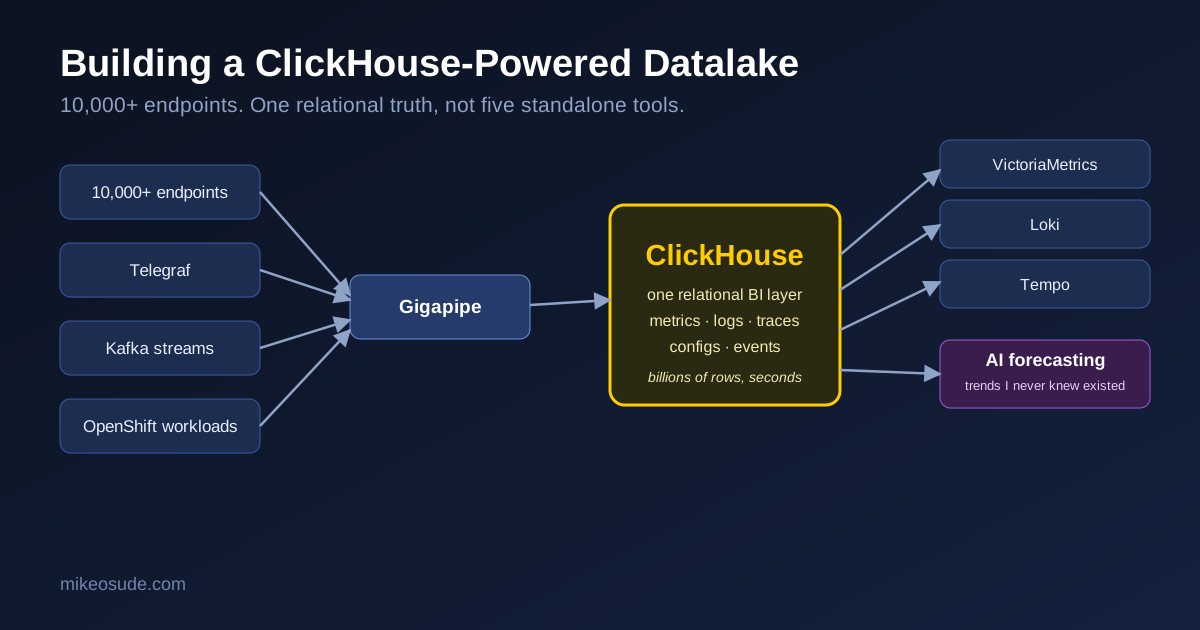
I’ve spent most of my career with observability tools that are each excellent at one thing. A metrics store that tells you something is slow right now. A log store that tells you what an application said about it. A trace store that tells you where the time went inside one request.
Standalone, they’re all genuinely good. I still run VictoriaMetrics, Loki and Tempo today, and they’re not going anywhere.
What they aren’t, on their own, is related to each other.
So I built the thing that sits underneath all three: a ClickHouse-powered datalake, aggregating everything — device configurations, metrics, logs, traces — from over 10,000 remote endpoints into a single place you can actually ask questions of.
This post is less a how-to and more the story of why that got me this excited, and what changed once it was running.
Where this actually started #
This didn’t begin at enterprise scale. It began at home.
I’d been feeding my UDM SE’s IDP/IDS events into my own homelab vLLM, and that’s what produced my first genuinely dynamic firewall rule — not another static policy I’d hand-written and would eventually forget to revisit, but something an AI model proposed from what it was actually watching happen on my network. The same pattern reached Home Assistant: instead of only the automations I’d explicitly scripted, a predictive model now decides whether an on/off action is even worth taking, based on what it’s seen before. It’s not as polished as I’d like yet — I’ll be the first to say that — but it’s real, it runs today, and it was the first time I felt an AI system reasoning about my environment instead of a generic one.
That’s the part that clicked for me:
We are as proactive and productive as the relational data we can make sense of. — Ifesinachi Osude, 10/06/2026
A static policy can only react to what someone already anticipated. A model watching relational data — events, state, history, all actually joinable — can react to what it’s currently seeing, not just what it was told to expect. That’s true whether it’s one home network or ten thousand endpoints. The only thing that changed between my living room and a fleet of 10,000+ endpoints was scale.
Standalone tools, one underlying truth #
The pipeline looks like this: Telegraf and the OpenShift workloads I run collect from the fleet, Kafka carries the stream, Gigapipe (a managed ClickHouse platform built for exactly this kind of observability load) fronts the ingestion, and it all lands in ClickHouse.
VictoriaMetrics, Loki and Tempo still exist above that — they’re still how I get live dashboards and alerting. But they’re no longer the only record of what happened. Underneath them is one columnar, relational store that every signal lands in, keyed so that a metric, a log line, a trace and a device’s own configuration about the same endpoint, same window of time can be joined with plain SQL instead of correlated by hand across three different query languages and three different retention windows.
That’s the part that used to require real, ongoing configuration effort — trying to get a metrics system, a log system and a trace system to agree enough on labels and time windows that a human could squint at three dashboards and convince themselves they were looking at the same incident. ClickHouse doesn’t need that negotiation. The relationship isn’t configured in advance and hoped for later. It’s either built at collection time, when something is pushed in already labeled correctly, or it’s built at query time, with a join. Pull or push — either way, the relationship actually exists in the data, not just in a dashboard layout.
Why ClickHouse, specifically #
I want to be direct about this part: ClickHouse earned this. It’s not the only analytical database that exists — Spark, Hadoop, Iceberg and the rest of that world are all legitimate, and plenty of serious companies run excellent platforms on them. But for what I needed, a handful of things about ClickHouse specifically made the difference:
- Structure. Everything lands in actual tables with actual schemas. Not a schema you reverse-engineer from whatever a log shipper happened to produce.
- Simplicity. Fewer moving parts than a typical big-data stack means fewer places for something to quietly break, and when something does break, there’s a lot less surface area to search before you find it.
- Real paid enterprise support. ClickHouse Inc. backs this thing commercially, not just as an open-source project with a GitHub issue queue. That matters when it’s carrying an organization’s own operational history.
- SQL, which everyone already speaks. Every engineer, every analyst, and — this turned out to matter a lot — every AI model already knows SQL. Nobody has to learn a new query language to get value out of this.
- Columnar storage and real compression, which is what makes keeping years of this data actually affordable instead of a constant argument about retention windows.
- A native Kafka table engine, so ClickHouse consumes streaming data directly instead of needing a separate consumer app glued in front of it.
- It scales the way the problem scales. 10,000+ endpoints is not a small number of rows per day, and sharding and replication mean the answer to “more endpoints” is “more nodes,” not “a redesign.”
And then there’s the part that’s hard to put in a bullet point: watching it actually ingest everything — device configs, metrics, logs, traces, all of it — and come back from a query across billions of rows in seconds. I’ve built a lot of infrastructure. That particular moment, watching it happen for the first time against a real production fleet, is what sent me down a genuinely nerdy rabbit hole.
Lake, river, or pond? #
I got curious enough about the “datalake” label that I actually went and looked up the difference between a lake, a river and a pond — not as infrastructure metaphors, as the actual dictionary definitions, because I wanted to know if I was using the word right.
A pond is small and still. A river is defined by constant, directional flow. A lake is a large, standing body that things flow into.
Kafka is the river — it’s the constant motion, data moving from ten thousand places toward one place. ClickHouse is the lake — it’s where everything that was flowing finally comes to rest, deep enough and large enough that you can actually explore what’s in it rather than just watching it go by. That distinction, pulled from a dictionary and not a vendor’s marketing page, is honestly a better explanation of this architecture than most of the official diagrams I’ve drawn for it.
Then I pointed an AI model at it #
This is the part that genuinely surprised me.
Before this existed, getting an AI model to reason across this telemetry meant a slow, expensive dance: probe the metrics store for the right labels, take those labels and go try them against the log store, take whatever came back and go try it against the trace store, and hope the labels lined up well enough across all three to mean the same thing. Every one of those is a separate tool call. Every one of those costs tokens, and costs time.
With everything already sitting in one relational store, that whole dance collapses into a query. The model asks ClickHouse directly — one shape of data, one place to look — and comes back with a trend across metrics, logs and traces at once, for a fraction of the tokens the old probing dance used to cost. And more than once, it’s surfaced a trend across the fleet that I didn’t already know was there, because no human was ever going to manually cross-reference ten thousand endpoints across three separate tools to find it.
That’s the actual payoff. Not “faster dashboards.” A model that can see the whole picture at once, cheaply enough to actually ask it things.
Where this goes next #
I’m still running VictoriaMetrics, Loki and Tempo, and I expect that for a long time — they’re good at what they do, and nothing about this replaces live alerting. What changed is that they’re no longer islands. Underneath them, for the first time, there’s one place where a metric, a log, a trace and a device’s own configuration agree on what endpoint and what moment they’re describing.
I’ve worked in observability long enough to get used to picking a tool and accepting its blind spots. Watching ClickHouse hold all of it at once, queryable, at a scale of ten thousand endpoints and counting, is the first time that’s felt less like a tradeoff and more like the actual shape the problem should have had all along.
Credit where it’s due: ClickHouse built one hell of a platform.