For years, organizations have relied on commercial monitoring products that promised visibility into their environments.
- Most delivered dashboards.
- Many delivered alerts.
- Very few delivered true understanding.
- The problem isn’t simply cost.
- The problem is control.
When an organization adopts a closed monitoring platform, it is often forced to view its infrastructure through the lens of what that vendor chooses to expose. Data collection, storage, retention, analytics, and integrations are frequently constrained by licensing models and product limitations.
When leadership asks questions such as:
- Where should we invest next year?
- Which datacenter will run out of capacity first?
- Which applications are consuming the most resources?
- What infrastructure should be expanded?
- What services should be consolidated?
- Where are we wasting money?
Traditional monitoring platforms often struggle to provide meaningful answers.
They can tell you when something is broken.
They rarely help you understand where the business should invest.
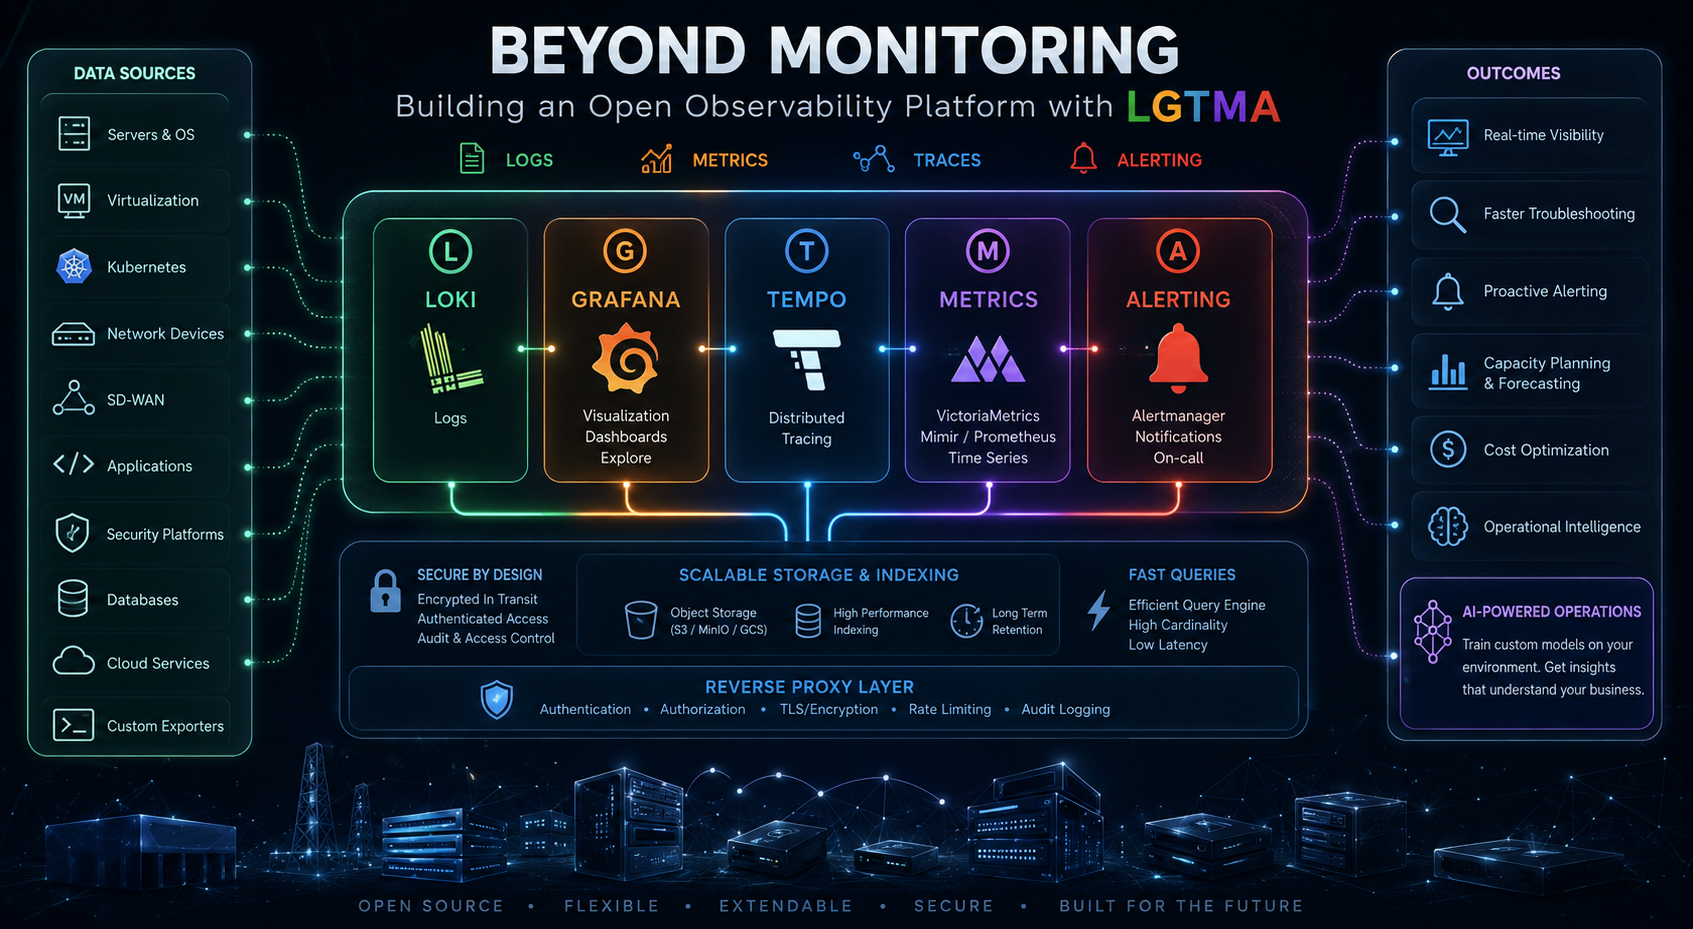
That realization was one of the driving forces behind our journey toward an open observability platform built around LGTMA:
- Loki
- Grafana
- Tempo
- Metrics (VictoriaMetrics, Mimir, Prometheus)
- Alerting
The result wasn’t simply better monitoring.
It was a foundation for operational intelligence.
The Hidden Cost of Closed Monitoring Platforms #
The most expensive monitoring platform is rarely the one with the highest license cost.
The most expensive platform is the one that prevents you from collecting the data you need.
Many organizations find themselves trapped in a cycle where every new requirement requires:
- Another module
- Another license
- Another collector
- Another appliance
- Another professional services engagement
Over time, monitoring becomes fragmented across multiple products.
Each platform contains part of the story.
None contain the whole story.
The organization ends up paying repeatedly for visibility that should already exist.
An open observability architecture changes this equation.
Instead of asking vendors what can be monitored, engineers decide what should be monitored.
Monitoring is Not Observability #
Traditional monitoring focuses on answering a single question:
Is it up?
Observability focuses on answering far more valuable questions:
Why did it fail?
and
What is likely to fail next?
That distinction is critical.
A server being online does not mean it is healthy.
A network link being operational does not mean users are having a good experience.
A Kubernetes cluster being available does not mean applications are functioning correctly.
True observability requires:
- Metrics
- Logs
- Traces
- Alerting
- Correlation
Each component provides a different perspective of reality.
Only together do they provide understanding.
Metrics: The Foundation for Forecasting #
Metrics are often treated as operational data.
In reality, they are business intelligence.
Over the years we have collected telemetry from:
- Servers
- Hypervisors
- Storage platforms
- Network infrastructure
- SD-WAN environments
- Security systems
- Kubernetes clusters
- Applications
The real value was not detecting outages.
The real value was trend analysis.
Historical metrics allow organizations to answer questions such as:
- When will storage capacity be exhausted?
- Which applications are consuming the most resources?
- Which sites require bandwidth upgrades?
- Which systems are overprovisioned?
- Which investments provide the greatest return?
Without long-term metrics retention, capacity planning becomes guesswork.
With sufficient historical data, infrastructure planning becomes data-driven.
This is where observability begins to transition from an operational tool into a business planning platform.
Logs: The Source of Truth #
Metrics tell you something happened.
Logs tell you why.
As environments become increasingly distributed, logs become one of the most valuable operational assets an organization possesses.
Centralized logging allows engineers to reconstruct events across:
- Infrastructure
- Applications
- Security platforms
- Containers
- Network devices
The ability to correlate activity across systems dramatically reduces troubleshooting time and improves operational awareness.
A well-designed logging platform transforms thousands of isolated events into a coherent operational narrative.
Traces: Following the Request #
Modern applications rarely exist on a single server.
A user request may traverse:
- Load balancers
- API gateways
- Microservices
- Databases
- External APIs
Without tracing, identifying bottlenecks becomes difficult.
Distributed tracing provides visibility into every stage of a transaction.
Rather than asking:
Why is the application slow?
Teams can ask:
Which component introduced the latency?
The difference is transformational.
Tracing transforms troubleshooting from investigation into analysis.
Alerting: The Most Underrated Component #
We cannot talk about observability without discussing the often-overlooked champion of the stack:
Alerting.
Collecting telemetry is important.
Storing telemetry is important.
Visualizing telemetry is important.
None of those matter if nobody knows when something goes wrong.
Humans cannot continuously watch:
- Dashboards
- Logs
- Graphs
- Traces
- Metrics
Twenty-four hours a day.
Alerting bridges that gap.
It transforms passive observability into active observability.
A well-designed alerting strategy ensures that the right people receive the right information at the right time.
More importantly, it allows organizations to focus on outcomes rather than dashboards.
The best observability platform is not the one with the most graphs.
It is the one that identifies problems before users do.
Data Collection Is Only the Beginning #
Many discussions around observability focus entirely on data collection.
Collecting telemetry is actually the easy part.
The harder questions are:
- How is the data stored?
- How long is it retained?
- How quickly can it be queried?
- How is it secured?
- How is access controlled?
As observability platforms grow, architecture becomes increasingly important.
Storage design directly impacts:
- Query performance
- Retention capabilities
- Operational costs
- Scalability
Security becomes equally critical.
Observability systems often contain information about every component of the enterprise.
For this reason, our observability architecture has increasingly moved toward encrypted communications, centralized authentication, and reverse proxy architectures that enforce security controls before requests ever reach backend services.
Whether the backend is Loki, Tempo, Mimir, VictoriaMetrics, or another telemetry platform, every request is authenticated, encrypted, and audited.
Observability data should be treated as a critical enterprise asset.
Because that is exactly what it is.
Building Custom Exporters #
One of the biggest advantages of open observability platforms is extensibility.
Eventually every organization encounters data that cannot be collected using off-the-shelf integrations.
This led us to develop custom collectors for areas such as:
- Inter-datacenter network monitoring
- SD-WAN telemetry
- Infrastructure discovery
- Application-specific metrics
- Business-specific operational data
The ability to convert virtually any data source into metrics, logs, or traces fundamentally changes what is possible.
Instead of adapting operations to fit a monitoring tool, the monitoring platform adapts to the business.
This flexibility is one of the defining characteristics of open observability.
The AI Opportunity #
Perhaps the most exciting aspect of modern observability is its relationship with AI.
Organizations everywhere are exploring AI initiatives.
Many are discovering they lack the data necessary to make AI truly useful.
Observability platforms solve this problem.
Metrics, logs, traces, alerts, inventories, and operational events collectively form a detailed record of how an environment behaves.
This data creates the foundation for:
- Anomaly detection
- Capacity forecasting
- Event correlation
- Root cause analysis
- Operational copilots
- Custom AI models
The future is not simply AI-assisted observability.
The future is observability-powered AI.
Organizations that invest in collecting and organizing operational telemetry today are creating the datasets that will train tomorrow’s operational intelligence systems.
An AI model that understands your environment, your infrastructure, your applications, your network, and your historical behavior can provide insights that generic models never will.
The LGTMA stack provides the foundation for that future.
Final Thoughts #
The journey toward observability is not about replacing one monitoring tool with another.
It is about building a platform that allows organizations to understand their environment on their own terms.
Open observability platforms provide something many commercial solutions cannot:
Freedom.
Freedom to collect the data you need.
Freedom to store it where you choose.
Freedom to analyze it how you want.
Freedom to secure it according to your standards.
Freedom to integrate AI into your operations without being constrained by vendor roadmaps.
And ultimately, freedom to transform operational data into business intelligence.
For me, that is the true value of observability.
Not knowing when something breaks.
Knowing enough about your environment to understand what to do next.