Introduction #
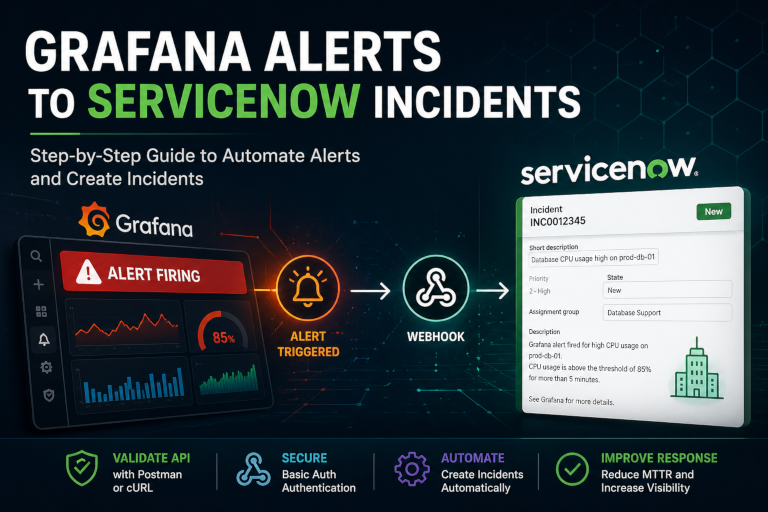
This guide explains how to configure Grafana alerts to create ServiceNow incidents automatically.
A critical part of this process is validating the ServiceNow API before configuring Grafana. In many organizations, the team that manages ServiceNow is not the same team that manages the LGTM stack. Testing first removes guesswork and proves that the credentials, roles, endpoint, and payload are working before Grafana is involved.
Postman is the preferred validation method because it clearly shows the response body, headers, status code, and returned incident fields. curl also works and is included as an alternative.
Prerequisites #
Create a dedicated ServiceNow integration user. Recommended roles:
itil
rest_service
sn_incident_write
sn_incident_edit
This guide uses:
Basic Authentication
Username + Password
Step 1: Validate ServiceNow with Postman #
Before configuring Grafana, confirm that the ServiceNow user can create an incident directly.
Postman Request
Method: POST
URL: https://YOUR_INSTANCE.service-now.com/api/now/table/incident
Authorization #
Type: Basic Auth
Username: YOUR_SERVICENOW_USERNAME
Password: YOUR_SERVICENOW_PASSWORD
Headers #
Accept: application/json
Content-Type: application/json
Body #
{
  "short_description": "Grafana API Test - Postman Validation",
  "description": "Testing ServiceNow incident creation before configuring Grafana.",
  "category": "Network",
  "subcategory": "Monitoring",
  "contact_type": "Integration",
  "impact": "2",
  "urgency": "2",
  "work_notes": "Created by Postman to validate ServiceNow API access."
}
Expected Successful Response #
A successful create request returns a single incident object:
{
  "result": {
    "number": "INCXXXXXXX",
    "sys_id": "xxxxxxxxxxxxxxxxxxxxxxxxxxxxxxxx"
  }
}
Save the number and sys_id. This proves the ServiceNow side is working.
Common Mistake
If the response looks like this:
{
  "result": []
}
or returns multiple old incidents, the request is probably using GET instead of POST.
Incident creation must use:
POSTStep 2: Validate with curl #
Postman is recommended, but the same test can be done with curl.
curl -X POST "https://YOUR_INSTANCE.service-now.com/api/now/table/incident" \
  -u "YOUR_SERVICENOW_USERNAME:YOUR_SERVICENOW_PASSWORD" \
  -H "Accept: application/json" \
  -H "Content-Type: application/json" \
  -d '{
    "short_description": "Grafana API Test - curl Validation",
    "description": "Testing ServiceNow incident creation using curl before configuring Grafana.",
    "category": "Network",
    "subcategory": "Monitoring",
    "contact_type": "Integration",
    "impact": "2",
    "urgency": "2",
    "work_notes": "Created by curl to validate ServiceNow API access."
  }'
The response should include:
"number": "INCXXXXXXX"and:
"sys_id": "xxxxxxxxxxxxxxxxxxxxxxxxxxxxxxxx"Do not move to Grafana until either Postman or curl successfully creates an incident.
Step 3: Configure Grafana Contact Point #
In Grafana, go to:
Alerting → Contact points → New contact pointUse the following configuration:
Integration: Webhook
URL: https://YOUR_INSTANCE.service-now.com/api/now/table/incident
HTTP Method: POST
Authentication:
HTTP Basic Authentication - Username: YOUR_SERVICENOW_USERNAME
HTTP Basic Authentication - Password: YOUR_SERVICENOW_PASSWORD
Extra headers:
Accept: application/json
Content-Type: application/json
Leave these blank:
Title: blank
Message: blank
This is important. Do not place the ServiceNow JSON body inside the Grafana Title or Message fields.
Step 4: Use Grafana Custom Payload #
Grafana’s default webhook payload does not match what the ServiceNow Incident Table API expects.
ServiceNow expects incident fields at the top level of the JSON body, such as:
short_description
description
category
subcategory
contact_type
impact
urgency
Use Grafana’s Custom Payload field for this.
{
  "short_description": "{{ .CommonLabels.instance }}: {{ .CommonLabels.alertname }} - {{ .Status }}",
  "description": "Grafana Alert Status: {{ .Status }}\n\nAlert Name: {{ .CommonLabels.alertname }}\nInstance: {{ .CommonLabels.instance }}\nSeverity: {{ .CommonLabels.severity }}\nJob: {{ .CommonLabels.job }}\n\nSummary:\n{{ .CommonAnnotations.summary }}\n\nDescription:\n{{ .CommonAnnotations.description }}\n\nGrafana URL:\n{{ .ExternalURL }}",
  "comments": "Grafana alert notification received. Status: {{ .Status }}",
  "work_notes": "Created automatically by Grafana webhook.",
  "category": "Network",
  "subcategory": "Monitoring",
  "contact_type": "Integration",
  "impact": "2",
  "urgency": "2",
  "correlation_id": "{{ .GroupKey }}",
  "correlation_display": "Grafana Alert - {{ .CommonLabels.alertname }}",
  "u_test_record": "true"
}
If your ServiceNow environment requires an assignment group, add:
"assignment_group": "YOUR_ASSIGNMENT_GROUP_SYS_ID"Step 5: Attach the Contact Point to an Alert #
Assign the ServiceNow contact point to a Grafana notification policy or directly to an alert rule.
Alert rule → Notifications → ServiceNow contact pointWhen the alert fires, Grafana should create a ServiceNow incident with a proper short description and detailed description.
Troubleshooting #
Incident is created, but short description is blank
The JSON payload was likely placed in the Grafana Title or Message field.
Fix:
Use Custom Payload
Leave Title blank
Leave Message blank
Old tickets are showing in the response
The request is likely using GET.
Fix:
Use POST for incident creationAuthentication fails in Grafana
Go back to Postman and confirm the same username and password still work.
If Postman fails, the issue is not Grafana.
Ticket is created but missing fields
Confirm that the ServiceNow field names match your instance.
Common fields:
short_description
description
comments
work_notes
category
subcategory
contact_type
impact
urgency
Important Note About Closing Incidents #
Directly posting from Grafana to:
/api/now/table/incidentis good for creating incidents. For production-grade create/update/close behavior, use a ServiceNow Scripted REST API or middleware. That gives you logic like:resolved → find incident by correlation_id and resolve it ``` The correlation_id should be based on a stable Grafana value such as: ``` {{ .GroupKey }} ``` or the alert fingerprint if your payload exposes it.
Conclusion #
The most important step is validating ServiceNow before Grafana.
Postman is the preferred method because it provides clear output and makes it easier to work across teams. Once the ServiceNow API is proven to work, Grafana configuration becomes much easier.
This setup provides a practical path for connecting Grafana alerting with ServiceNow incident management while keeping the integration simple and repeatable.